This Web
Server Resource monitor displays statistics about the resource usage on
the Microsoft Internet Information Server (IIS) during the scenario run.
To obtain data for this graph, you need to configure the MS IIS online monitor (from the Controller) and select the measurements you want to display, before running the scenario. You select measurements for the Microsoft IIS Server monitor using the MS IIS dialog box.
Note: To monitor an IIS server through a firewall, use TCP, port .
- Adding a Machine to Monitor on page
- Configuring the Microsoft IIS Monitor
- Microsoft IIS Performance Counters
Adding a Machine to Monitor
In order to monitor the Microsoft_IIS server from the Controller, you need to add the machine and the measurements you want to monitor.
To add a machine to the Controller:
1. Click the MS IIS graph in the graph tree, and drag it into the right pane of the Run view.
2. Right-click the graph and select Add Measurements, or click anywhere on the graph and choose Monitors > Add Measurements. The MS IIS dialog box opens.In the Monitored Server Machines section, click Add. The Add Machine dialog box opens.
3. Enter the server name or IP address of the machine you want to monitor.
Select the platform on which the machine runs, and click OK.
4.In the Resource Measurements on: section of the MS-IIS dialog box, the default measurements are displayed.
5.Continue with Configuring the Microsoft IIS Monitor below.
Configuring the Microsoft IIS Monitor:
After you have added the machine that you are monitoring, you configure the monitor by choosing which objects to monitor on the machine.
1. When you click Add to add a measurement, the MS IIS dialog box opens displaying the Web Service object, its counters, and instances opens.
For each measurement, select an object, counter, and instance, and then click Add, as described in “Understanding the MS IIS Dialog Box” on.
Note: To change the default counters for the Microsoft IIS Server monitor, see “Changing a Monitor’s Default Counters”.
2. Add all the desired resources to the list, and click Close.
3. Click OK in the MS IIS dialog box to activate the monitor.
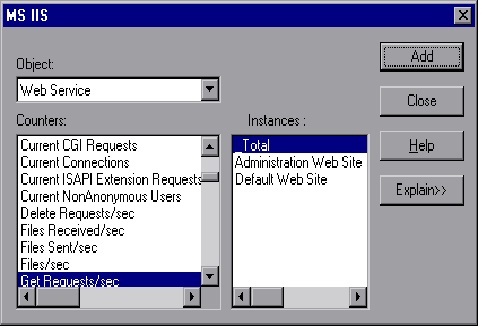
Understanding the MS IIS Dialog Box
The MS IIS dialog box lets you select the items to monitor on the MS IIS server.
In order to monitor the Microsoft_IIS server from the Controller, you need to add the machine and the measurements you want to monitor.
To add a machine to the Controller:
1. Click the MS IIS graph in the graph tree, and drag it into the right pane of the Run view.
2. Right-click the graph and select Add Measurements, or click anywhere on the graph and choose Monitors > Add Measurements. The MS IIS dialog box opens.In the Monitored Server Machines section, click Add. The Add Machine dialog box opens.
3. Enter the server name or IP address of the machine you want to monitor.
Select the platform on which the machine runs, and click OK.
4.In the Resource Measurements on: section of the MS-IIS dialog box, the default measurements are displayed.
- To delete a measurement from the default list, select the measurement and click Delete.
- To select additional measurements, click Add. A dialog box opens displaying all the available measurements.
5.Continue with Configuring the Microsoft IIS Monitor below.
Configuring the Microsoft IIS Monitor:
After you have added the machine that you are monitoring, you configure the monitor by choosing which objects to monitor on the machine.
1. When you click Add to add a measurement, the MS IIS dialog box opens displaying the Web Service object, its counters, and instances opens.
For each measurement, select an object, counter, and instance, and then click Add, as described in “Understanding the MS IIS Dialog Box” on.
Note: To change the default counters for the Microsoft IIS Server monitor, see “Changing a Monitor’s Default Counters”.
2. Add all the desired resources to the list, and click Close.
3. Click OK in the MS IIS dialog box to activate the monitor.
Understanding the MS IIS Dialog Box
The MS IIS dialog box lets you select the items to monitor on the MS IIS server.
- Object: Select the object being monitored on the specified machine.
- Counters: Select a resource counter to monitor. Select multiple counters using the CTRL key. For an explanation of each counter, click Explain.
- Instances:If multiple instances of the selected counter are running, select one or more instances to monitor for the selected counter.

